The world’s most popular instruments at your fingertips
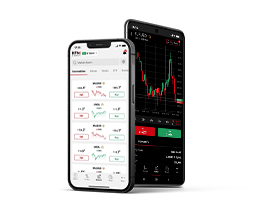
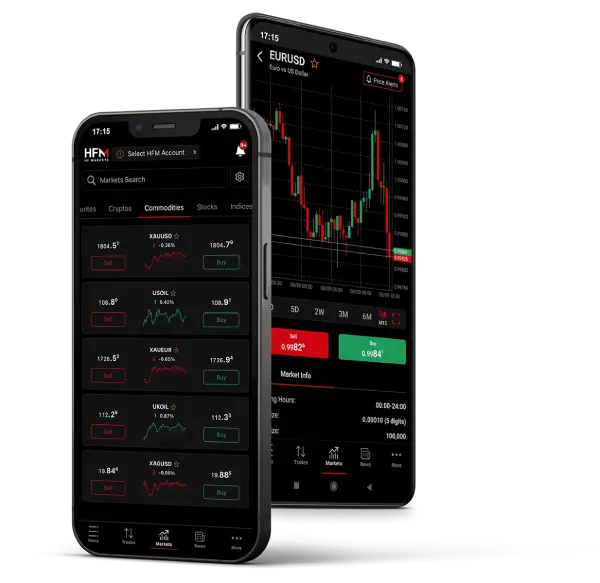
Trade online wherever you are with the HFM App.

Follow the world’s most popular indices, such as the S&P 500 and the Dow Jones Industrial Average to gain a more diversified and balanced exposure to the market they represent and benefit from overall market trends, rather than relying on the performance of individual CFD stocks.
Ultra-fast execution
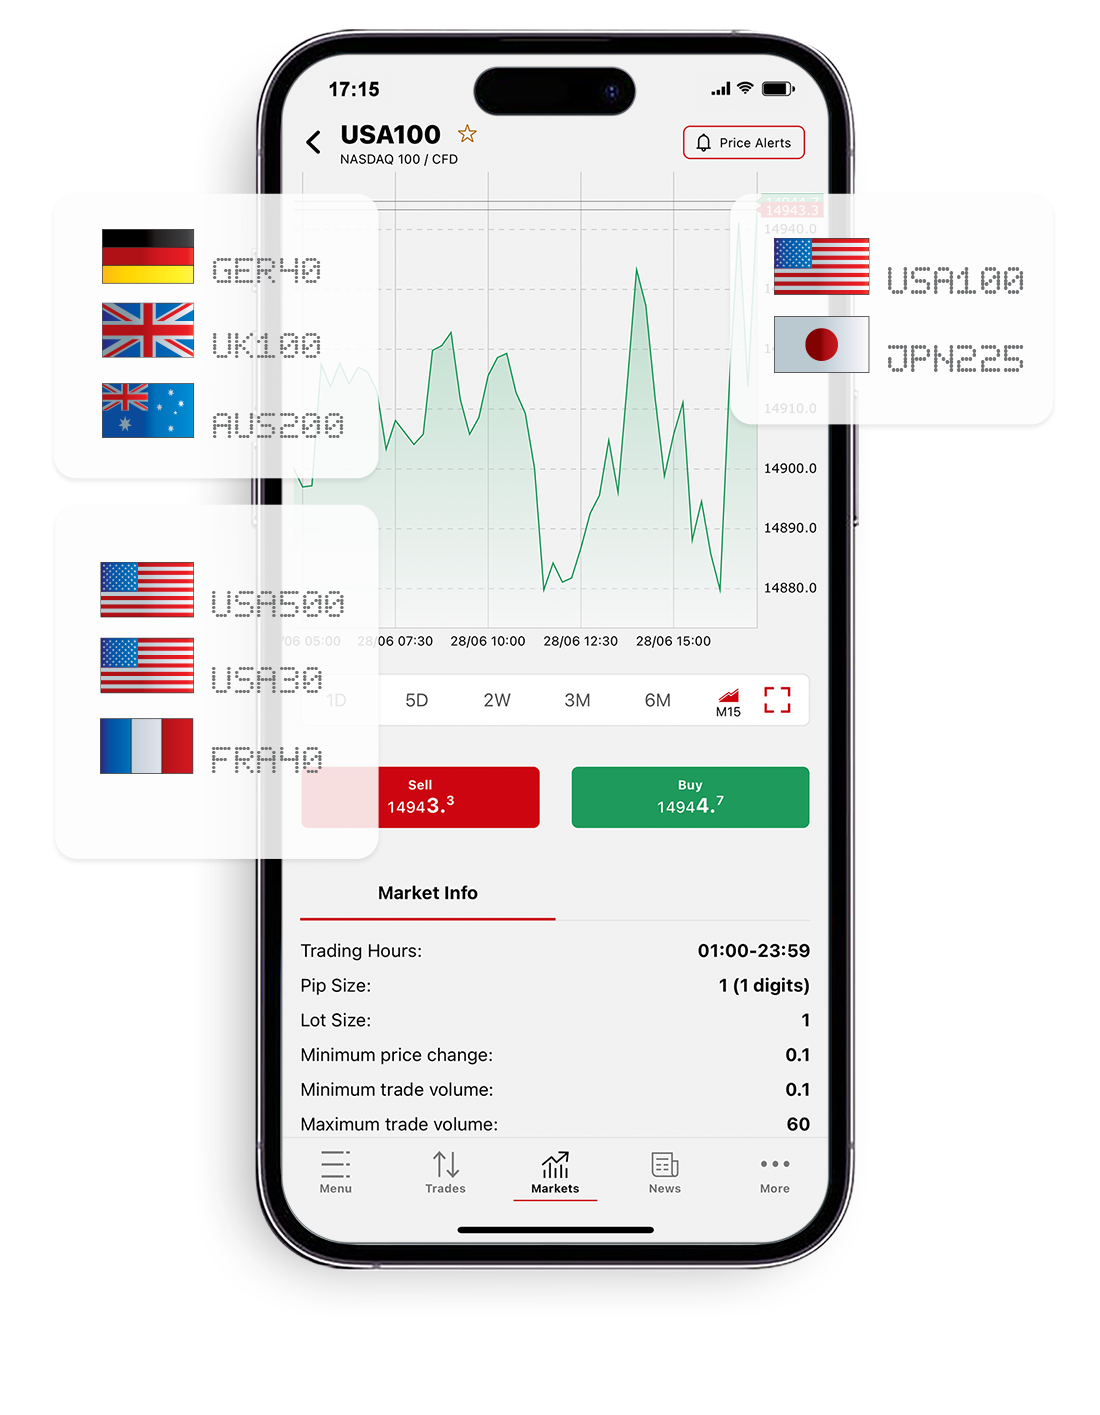
Access global indices including USA500 and UK100
Low margin requirements
Trade on both rising and falling prices
Exposure to an entire sector at once
Portfolio diversification
Go long or short on the world’s major stock indices
| Swap values in margin currency | Trading Hours | ||||||||
|---|---|---|---|---|---|---|---|---|---|
| Symbol | Description | Spreads as low as | Leverage (up to) | Short | Long | Monday Open |
Friday Close |
Break | |
| GER40 | Germany 40 | 1.4 | Infinity | -0.5 | -3.53 | 3:35:00 | 22:58:59 | - | |
| JPN225 | Japan 225 | 9.0 | Infinity | -3.22 | -6.89 | 1:05:00 | 23:57:59 | - | |
| UK100 | UK 100 | 0.9 | Infinity | 0.35 | -2.17 | 1:05:00 | 22:57:59 | - | |
| USA100 | US Tech 100 | 1.5 | Infinity | 0.96 | -6.16 | 1:05:00 | 23:57:59 | ||
| USA30 | US Wall Street 30 | 1.6 | Infinity | 1.65 | -10.6 | 1:05:00 | 23:57:59 | ||
| USA500 | US SPX500 | 0.4 | Infinity | 0.24 | -1.54 | 1:05:00 | 23:57:59 | ||
| Swap values in margin currency | Trading Hours | ||||||||
|---|---|---|---|---|---|---|---|---|---|
| Symbol | Description | Spreads as low as | Leverage (up to) | Short | Long | Monday Open |
Friday Close |
Break | |
| Swap values in margin currency | Trading Hours | ||||||||
|---|---|---|---|---|---|---|---|---|---|
| Symbol | Description | Spreads as low as | Leverage (up to) | Short | Long | Monday Open |
Friday Close |
Break | |
| AUS200 | Australian 200 | 1.4 | 1:500 | 0.41 | -2.06 | 2:55:00 | 23:57:59 | 09:30:00-10:09:59 | |
| FRA40 | France 40 | 1.1 | 1:500 | -0.5 | -1.2 | 9:05:00 | 22:58:59 | - | |
| GER40 | Germany 40 | 1.2 | 1:1000 | -0.5 | -3.53 | 3:35:00 | 22:58:59 | - | |
| JPN225 | Japan 225 | 10.0 | 1:500 | -3.22 | -6.89 | 1:05:00 | 23:57:59 | - | |
| NETH25 | Netherlands 25 | 1.0 | 1:500 | -0.5 | -0.85 | 9:05:00 | 22:58:59 | - | |
| SPA35 | Spain 35 | 4.9 | 1:500 | -0.5 | -2.72 | 9:05:00 | 20:59:59 | - | |
| SUI20 | Switzerland 20 | 2.9 | 1:500 | -1.01 | -0.98 | 9:05:00 | 22:58:59 | - | |
| UK100 | UK 100 | 1.0 | 1:500 | 0.35 | -2.17 | 1:05:00 | 23:57:59 | - | |
| USA100 | US Tech 100 | 1.2 | 1:1000 | 0.96 | -6.16 | 1:05:00 | 23:57:59 | - | |
| USA30 | US Wall Street 30 | 2.9 | 1:1000 | 1.65 | -10.6 | 1:05:00 | 23:57:59 | - | |
| USA500.S | US SPX500 | 0.4 | 1:1000 | 0.24 | -1.54 | 1:05:00 | 23:57:59 | - | |
| HK50 | Hong Kong 50 | 6.5 | 1:500 | -0.5 | -3.51 | 4:15:00 | 22:00:00 | 07:00:00 - 08:00:00 And 11:30:00 - 12:15:00 | |
| Swap values in margin currency | Trading Hours | ||||||||
|---|---|---|---|---|---|---|---|---|---|
| Symbol | Description | Spreads as low as | Leverage (up to) | Short | Long | Monday Open |
Friday Close |
Break | |
| EU50.F | EU STOXX 50 | 2.9 | 1:200 | 0.0 | 0.0 | 3:20:00 | 22:59:59 | - | |
| FRA40.F | France 40 | 3.2 | 1:200 | 0.0 | 0.0 | 9:05:00 | 22:58:59 | - | |
| GER40.F | Germany 40 | 3.2 | 1:1000 | 0.0 | 0.0 | 2:20:00 | 22:58:59 | - | |
| JP225.F | Japan 225 | 11.0 | 1:500 | 0.0 | 0.0 | 1:05:00 | 23:57:59 | - | |
| N25.F | Netherlands 25 | 0.53 | 1:200 | 0.0 | 0.0 | 9:05:00 | 22:58:59 | - | |
| SUI20.F | Switzerland 20 | 4.0 | 1:200 | 0.0 | 0.0 | 9:05:00 | 22:58:59 | - | |
| UK100.F | UK 100 | 4.2 | 1:200 | 0.0 | 0.0 | 3:05:00 | 23:57:59 | - | |
| US100.F | US Tech 100 | 3.0 | 1:1000 | 0.0 | 0.0 | 1:05:00 | 23:57:59 | - | |
| US30.F | US Wall Street 30 | 6.0 | 1:1000 | 0.0 | 0.0 | 1:05:00 | 23:57:59 | - | |
| US500.F | US SPX500 | 0.75 | 1:1000 | 0.0 | 0.0 | 1:05:00 | 23:57:59 | - | |
| USDIndex | US Dollar Index | 0.04 | 1:100 | -5.5 | -8.5 | 3:05:00 | 23:57:59 | - | |
| Swap values in margin currency | Trading Hours | ||||||||
|---|---|---|---|---|---|---|---|---|---|
| Symbol | Description | Spreads as low as | Leverage (up to) | Short | Long | Monday Open |
Friday Close |
Break | |
| AUS200 | Australian 200 | 1.4 | 1:500 | 0.41 | -2.06 | 2:55:00 | 23:57:59 | 09:30:00-10:09:59 | |
| FRA40 | France 40 | 1.1 | 1:500 | -0.5 | -1.2 | 9:05:00 | 22:58:59 | - | |
| GER40 | Germany 40 | 1.2 | 1:1000 | -0.5 | -3.53 | 3:35:00 | 22:58:59 | - | |
| JPN225 | Japan 225 | 10.0 | 1:500 | -3.22 | -6.89 | 1:05:00 | 23:57:59 | - | |
| NETH25 | Netherlands 25 | 1.0 | 1:500 | -0.5 | -0.85 | 9:05:00 | 22:58:59 | - | |
| SPA35 | Spain 35 | 4.9 | 1:500 | -0.5 | -2.72 | 9:05:00 | 20:59:59 | - | |
| SUI20 | Switzerland 20 | 2.9 | 1:500 | -1.01 | -0.98 | 9:05:00 | 22:58:59 | - | |
| UK100 | UK 100 | 1.0 | 1:500 | 0.35 | -2.17 | 1:05:00 | 23:57:59 | - | |
| USA100 | US Tech 100 | 1.2 | 1:1000 | 0.96 | -6.16 | 1:05:00 | 23:57:59 | - | |
| USA30 | US Wall Street 30 | 2.9 | 1:1000 | 1.65 | -10.6 | 1:05:00 | 23:57:59 | - | |
| USA500.S | US SPX500 | 0.4 | 1:1000 | 0.24 | -1.54 | 1:05:00 | 23:57:59 | - | |
| HK50 | Hong Kong 50 | 6.5 | 1:500 | -0.5 | -3.51 | 4:15:00 | 22:00:00 | 07:00:00 - 08:00:00 And 11:30:00 - 12:15:00 | |
| Swap values in margin currency | Trading Hours | ||||||||
|---|---|---|---|---|---|---|---|---|---|
| Symbol | Description | Spreads as low as | Leverage (up to) | Short | Long | Monday Open |
Friday Close |
Break | |
| EU50.F | EU STOXX 50 | 2.9 | 1:200 | 0.0 | 0.0 | 3:20:00 | 22:59:59 | - | |
| FRA40.F | France 40 | 3.2 | 1:200 | 0.0 | 0.0 | 9:05:00 | 22:58:59 | - | |
| GER40.F | Germany 40 | 3.2 | 1:1000 | 0.0 | 0.0 | 2:20:00 | 22:58:59 | - | |
| JP225.F | Japan 225 | 11.0 | 1:500 | 0.0 | 0.0 | 1:05:00 | 23:57:59 | - | |
| N25.F | Netherlands 25 | 0.53 | 1:200 | 0.0 | 0.0 | 9:05:00 | 22:58:59 | - | |
| SUI20.F | Switzerland 20 | 4.0 | 1:200 | 0.0 | 0.0 | 9:05:00 | 22:58:59 | - | |
| UK100.F | UK 100 | 4.2 | 1:200 | 0.0 | 0.0 | 3:05:00 | 23:57:59 | - | |
| US100.F | US Tech 100 | 3.0 | 1:1000 | 0.0 | 0.0 | 1:05:00 | 23:57:59 | - | |
| US30.F | US Wall Street 30 | 6.0 | 1:1000 | 0.0 | 0.0 | 1:05:00 | 23:57:59 | - | |
| US500.F | US SPX500 | 0.75 | 1:1000 | 0.0 | 0.0 | 1:05:00 | 23:57:59 | - | |
| USDIndex | US Dollar Index | 0.04 | 1:100 | -5.5 | -8.5 | 3:05:00 | 23:57:59 | - | |
Important
Contract Expiration Dates
| Symbol | January | February | March | April | May | June | July | August | September | October | November | December | |
|---|---|---|---|---|---|---|---|---|---|---|---|---|---|
| USDIndex | 10/03/2026 | 09/06/2026 | 10/09/2026 | 11/12/2025 | |||||||||
| GER40.F | 18/03/2026 | 18/06/2026 | 17/09/2026 | 17/12/2026 | |||||||||
| FRA40.F | 15/01/2026 | 18/02/2026 | 18/03/2026 | 16/04/2026 | 14/05/2026 | 17/06/2026 | 15/07/2026 | 20/08/2026 | 17/09/2026 | 15/10/2026 | 19/11/2026 | 17/12/2026 | |
| US30.F | 18/03/2026 | 16/06/2026 | 16/09/2026 | 17/12/2025 | |||||||||
| EU50.F | 18/03/2026 | 17/06/2026 | 16/09/2026 | 16/12/2026 | |||||||||
| JP225.F | 10/03/2026 | 09/06/2026 | 09/09/2026 | 09/12/2026 | |||||||||
| UK100.F | 18/03/2026 | 16/06/2026 | 17/09/2026 | 19/12/2025 | |||||||||
| US100.F | 18/03/2026 | 16/06/2026 | 17/09/2025 | 16/12/2026 | |||||||||
| US500.F | 18/03/2026 | 16/06/2026 | 16/09/2026 | 16/12/2026 | |||||||||
| SUI20.F | 18/03/2026 | 17/06/2026 | 17/09/2026 | 17/12/2026 | |||||||||
| N25.F | 15/01/2026 | 18/02/2026 | 18/03/2026 | 16/04/2026 | 14/05/2026 | 17/06/2026 | 15/07/2026 | 20/08/2026 | 17/09/2026 | 15/10/2026 | 19/11/2026 | 17/12/2026 |
Indices trading refers to buying and selling financial instruments that track the performance of a group of stocks or other financial assets, rather than individual securities.
An index is essentially a measurement of the performance of a particular market, and indices trading involves trading on the direction of that market by buying or selling derivatives based on the index.
For example, the S&P 500 index tracks the performance of the top 500 publicly traded companies in the United States.
By trading S&P 500 futures contracts, traders can trade on whether they believe the overall value of those companies will go up or down.
Indices trading can be done through a variety of financial instruments, including contracts for difference (CFDs) which allows for leveraged trading. At HFM, you can trade CFDs on major Indices, such as UK 100 and GER 40, with leverage and ultra-fast execution.
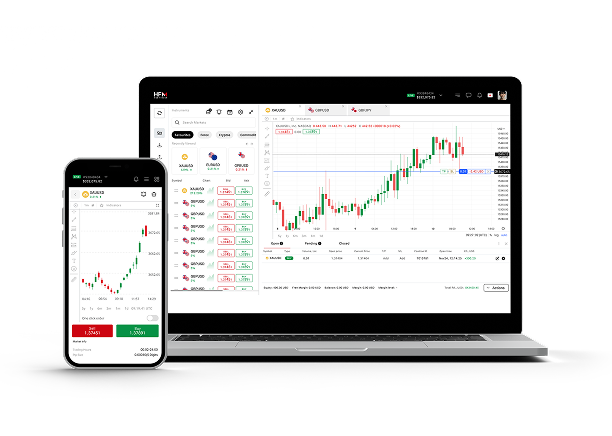
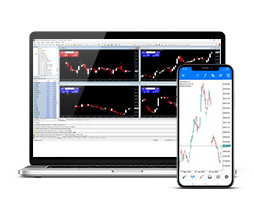
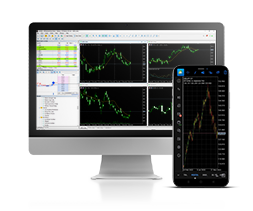
You can choose between HFM WebTrader, the MT4 and MT5 platforms and the HFM App to start trading CFDs on Indices.

Ready to learn more about online trading?
Visit our online Trading Education Center for more.
Access a wide range of desktop, web and mobile Trading Platforms including HFM WebTrader, MetaTrader 4, MetaTrader 5 and the HFM platform.
If you are interested in indices trading, start by learning the basics of indices trading, including how it works, the risks involved, and the different trading strategies. Then, open an HFM live or demo trading account, choose your index and open your position.
There are several factors that can influence the value of the assets in an index and therefore impact the price of the index itself. Some of these factors include:
The most traded indices in the world are:
These indices are popular with investors because they provide a broad representation of the stock market and can be used to track the performance of different sectors and industries.
Going long on an index means buying the index in the expectation that its value will increase over time. Essentially, an investor buys the index with the hope of selling it at a higher price in the future and making a profit. Going long on an index is a bullish strategy, as the investor is expecting that the market will rise.
On the other hand, going short on an index means selling the index in the expectation that its value will decrease over time. Essentially, an investor borrows the index, sells it at the current market price, and buys it back later at a lower price to return it to the lender, thereby making a profit. Going short on an index is a bearish strategy, as the investor is expecting that the market will decline.
Short selling can be riskier than going long, as there is theoretically no limit to how high a market can go, while it is limited how low it can go. This means that a short seller may be forced to buy back the index at a higher price than they sold it, resulting in a loss.
Both long and short strategies can be used by investors to achieve their investment goals and manage their risk exposure. It is important to note that trading in indices can be complex, and investors should carefully consider their investment objectives, risk tolerance, and financial situation before engaging in these types of trades.